Analyze campaign: e-commerce
How to analyze the Campaign Performance on your Website?
Learn what each of the titles means on the campaign performance chart on websites.
Hypolake offers several features for you to analyze your campaigns. This graph presents some performance points from the number of clicks to the ROI`s.
Finding it is simple:
Step 1. Locate and click under the button on the left side of your screen referring to the “campaigns” page as represented in the image below

Step 2. On this screen you will see your campaigns.
Step 2.1. Find a campaign with one of the objectives:
- website/virtual store;
- website/virtual store and social networks.
The goal is identified on the top left of each campaign card as in the following image:
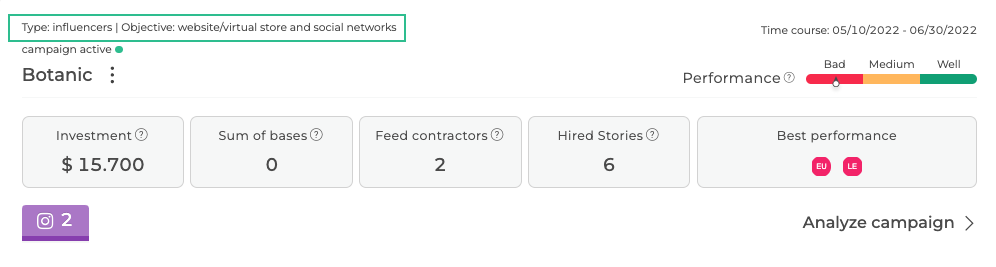
Step 2.2. Then select the campaign you want by clicking the “Analyze campaign” button in the lower right corner of the card.
Step 3. Find the graphic with the following title: “Campaign performance on your website/virtual store”.
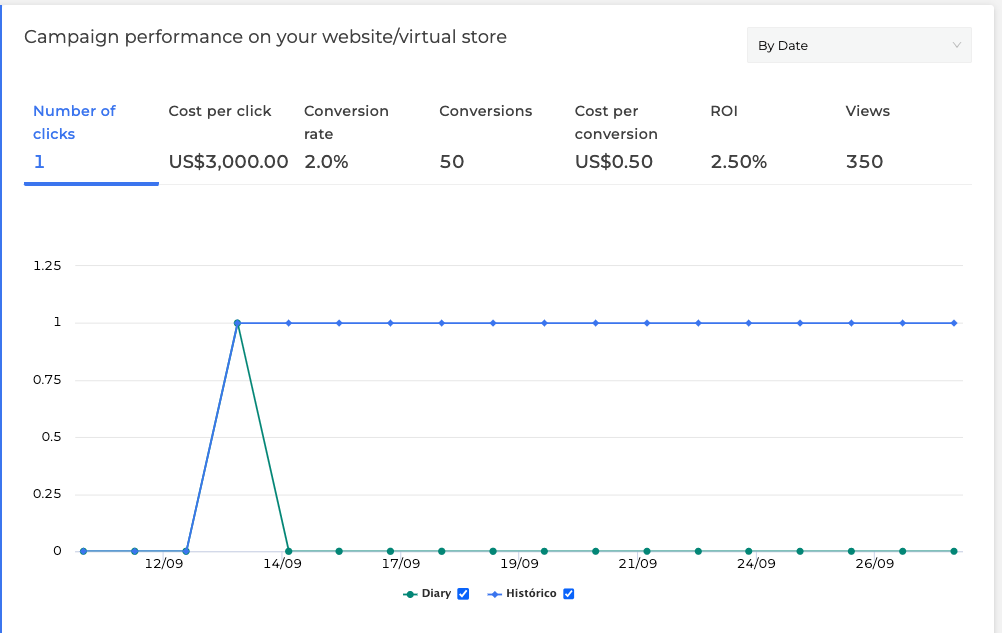
Now let’s begin to understand each of the items in your campaign.
Item 1. Number of clicks
View the total number of clicks obtained on your campaign posts.
Item 2. Cost per click
Get an estimate of how much each click in your campaign is costing you.
Item 3. Conversion Rate
Find out the percentage of conversions your campaign is getting. This is calculated from the total number of sales generated, divided by the total number of visits your campaign gets.
Item 4. Conversions
This is the absolute number of sales your campaign generated.
Item 5. Cost per conversion
Find out how much each of your conversions is costing you.
Item 6. ROI (Return on Total Investment)
Based on your investment and your conversion rate view the percentage return your campaign is generating.
Item 7. Views
Find out how many people viewed the content posted in your campaign.
We hope this article has helped you. If you still have questions, please contact our support.